
Before you start
Sign in with the account provided by Syncly and select your prepared workspace. If no Query is set up yet, contact your workspace administrator, or create a Query if you have Editor or Admin permission. With Viewer permission, you can start by exploring existing Query results.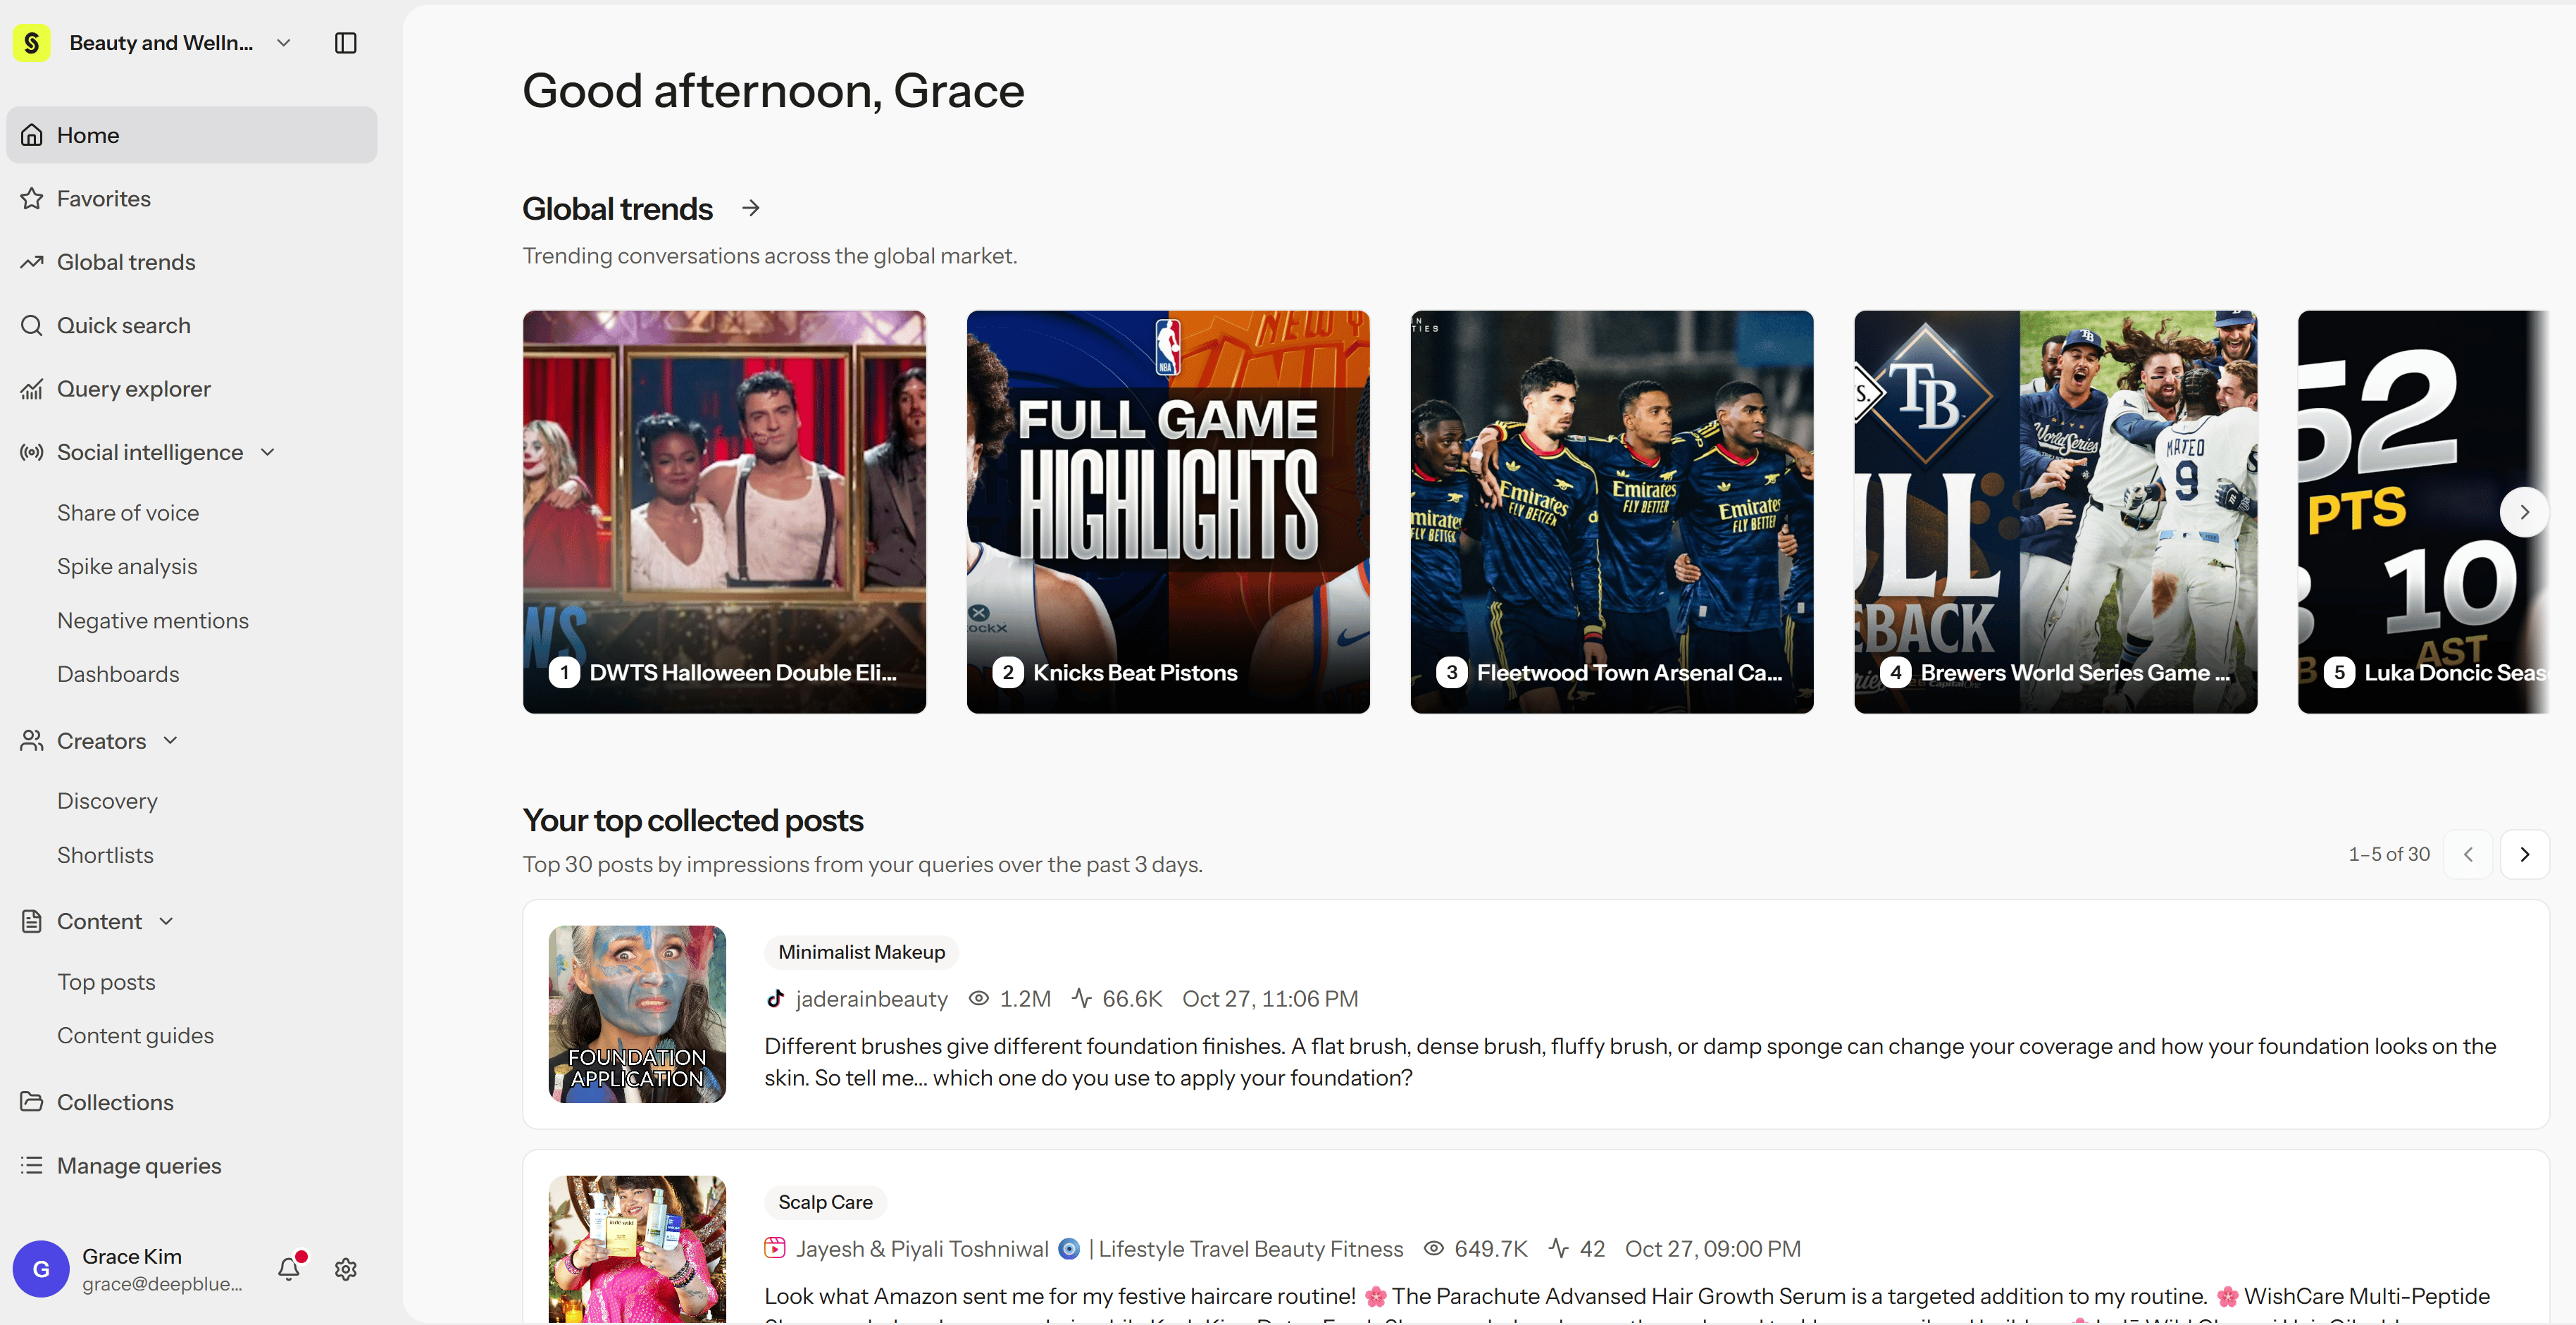
1. Check the prepared Query
In the sidebar, open Manage queries and select a Query. In the Posts tab, check the collected posts and date range. Use Query settings to review what the Query tracks, and Noise posts to see examples that were excluded as noise.2. Compare results
Open Query explorer from the sidebar, or select Explore on a Query in Manage queries to start with that Query selected. In the Queries panel, add other Queries of the same type to compare. Set the date range and filters, then explore the Performance, Sentiment, and Conversation tabs. To see your brand’s share of the conversation against competitors, use Share of voice under Social intelligence.3. Review the underlying posts
Open a post from the Posts tab to see its original content and analysis. Select key posts and save them to Collections to share evidence with your team. For important conclusions, check the original post for context.4. Ask Hey Syncly
Select posts and choose Ask Hey Syncly, or select ✨ Hey Syncly at the top right to ask about your current Queries and filters. Check the selected posts and filters shown in the prompt box, then ask your question, such as a summary, a comparison, or common complaints.5. Save and share the results
Save key posts to Collections to share them with teammates in your workspace. When you need post data in a spreadsheet, use Export (XLSX) on the post list. To share a set of charts, open a dashboard under Dashboards and use the Share menu at the top right (Copy link or Export to PDF).XLSX Export uses the latest matching post data when it creates the file. When it’s ready, download it from Workspace settings > Exports.
Confirm your first analysis
- You can explain the Query, date range, and filter settings.
- You reviewed the source posts behind your comparison.
- You checked the AI answers against the original posts.
- You organized key posts in Collections or exported results to XLSX or PDF.